Two cannabis brands can sit side by side on a Pennsylvania menu, one selling roughly a third as many units as the other, and still finish the month ahead on revenue.
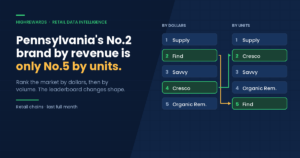
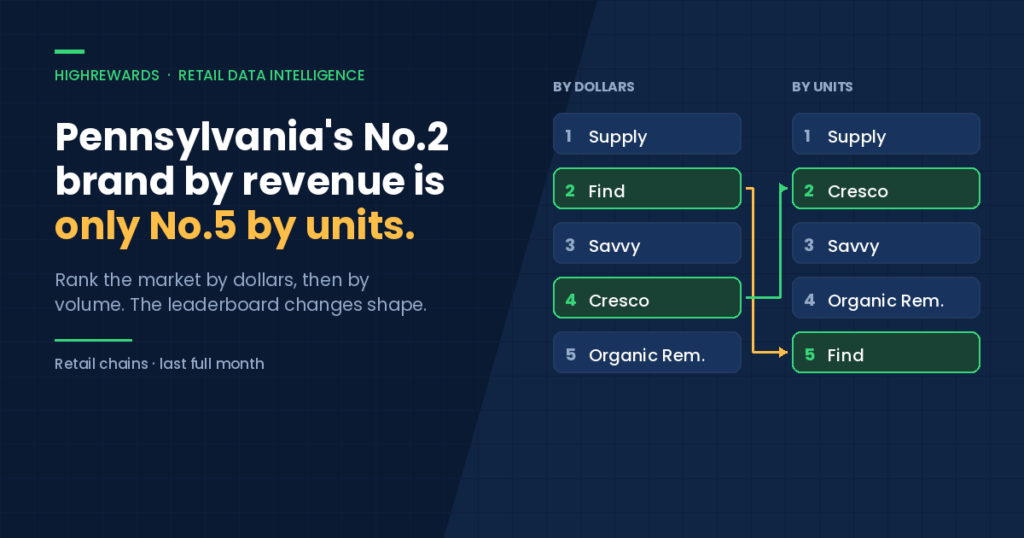
Across Pennsylvania retail chains last month, seven of the ten biggest cannabis brands changed position when ranked by units sold instead of dollars. The brand sitting second on the revenue chart was only fifth by volume.
If you set shelf space, buying priorities or marketing spend off a revenue leaderboard, you are reading a price signal and calling it demand.
The leaderboard depends on what you count
Here are Pennsylvania’s top ten brands last month, ranked both ways. Shares are expressed as each brand’s portion of the top ten, so the two columns are directly comparable.
| Brand | Rank by revenue | Rank by units | Share of top-ten revenue | Share of top-ten units |
|---|---|---|---|---|
| Supply | 1 | 1 | 25.9% | 26.1% |
| Find | 2 | 5 | 13.9% | 8.5% |
| Savvy | 3 | 3 | 11.8% | 13.7% |
| Cresco | 4 | 2 | 11.0% | 14.6% |
| Organic Remedies | 5 | 4 | 8.3% | 10.3% |
| Grassroots | 6 | 7 | 7.1% | 6.3% |
| Good Green | 7 | 8 | 6.7% | 5.6% |
| Select | 8 | 9 | 5.9% | 5.2% |
| &Shine | 9 | 6 | 4.9% | 6.5% |
| Modern Flower | 10 | 10 | 4.5% | 3.1% |
Only three brands hold the same rank on both lists. Find drops three places, &Shine climbs three, and Cresco moves from fourth on dollars to second on volume, outselling Find by units while trailing it on revenue.
Price tier is doing most of the work
The gap is not a data artefact. It is price. Find’s average price per purchase runs about 64% above the market leader’s and more than double Cresco’s. That is enough to carry a brand up the revenue chart on a fraction of the transactions.
Neither position is better than the other. They are different businesses. A premium brand earns its rank from margin per transaction; a value brand earns its rank from how many hands it gets into. The mistake is treating one chart as a measure of both.
What it changes for a retail buyer
- Facings should follow units, not dollars. A brand at 8.5% of top-ten volume does not need the shelf presence its revenue rank implies.
- Out-of-stocks cost more on volume brands. Missing a high-velocity value brand for a weekend touches far more shoppers than missing a premium one.
- Promotions read differently. Discounting a premium brand can flatter units while quietly compressing the margin that justified carrying it.
What it changes for a brand
- If you are winning on price tier, your revenue rank overstates your household reach. Fewer people know you than the chart suggests.
- If you are winning on volume, your revenue rank understates it. You have more shoppers to talk to than your placement in a buyer’s deck implies.
- Either way, track both numbers. A brand that gains revenue share while losing unit share is trading reach for price, and that trade has a floor.
The market underneath
Pennsylvania was close to flat last month, down 0.3% against the prior period, so none of this is being driven by a market swing. Shoppers came back at a healthy rate: 61.2% made a second visit and 39.6% reached a third.
Category reach was concentrated. Flower reached 82.0% of Pennsylvania shoppers last month, vapes 62.9%, edibles 31.7% and concentrates 27.0%. With flower that dominant, brand rank in Pennsylvania is largely a flower pricing story.
We looked at the same market from a pure share angle earlier this year in our Pennsylvania cannabis brand market share report. Reach matters more here than in most categories, because brands cannot buy their way to awareness: Google, Meta and TikTok still refuse cannabis, which is why most cannabis brands have to build reach through owned and rewards channels instead.
Frequently asked questions
Why do cannabis brand rankings change when you count units instead of revenue?
Because average price varies widely between brands. A premium brand can take a larger share of spend on far fewer transactions, so it ranks high on revenue and lower on volume. In Pennsylvania last month, seven of the top ten brands changed position between the two rankings.
Which ranking should a dispensary buyer use?
Both, for different decisions. Unit rank is the better guide to shelf space, stock cover and how many shoppers a brand actually reaches. Revenue rank is the better guide to margin contribution and category value.
How concentrated is the Pennsylvania cannabis brand market?
It remains fragmented. No single brand held more than 14.5% of tracked retail spend in the state last month, and the top eight brands together accounted for just over half of it.
Where does this data come from?
It comes from aggregated, anonymised receipt data uploaded by HighRewards members across Pennsylvania retail chains, filtered to retail chains only for the most recent full month. No individual shopper data is published.
See your market the way your shoppers actually shop it
HighRewards tracks real receipts across dispensaries, so operators and brands can see share of wallet, repeat rate, unit velocity and category mix in their own state. Get in touch for a market report.