Ohio cannabis retail grew last month. How it grew is the more useful story.
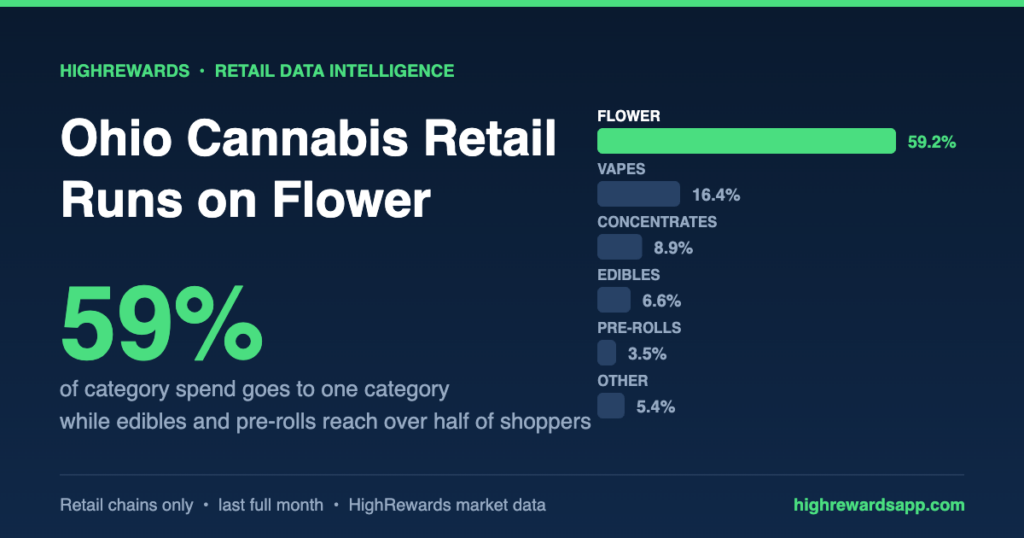
Across retail chains in the state, flower took 59.2% of category spend. Every other category combined split the remainder. Vapes came second at 16.4%. Concentrates took 8.9%. Edibles, the category operators talk about most when they talk about growth, took 6.6%.
That gap is not a rounding error. It is the shape of the market.
Flower takes nearly six in ten category dollars
| Category | Share of category spend |
|---|---|
| Flower | 59.2% |
| Vapes | 16.4% |
| Concentrates | 8.9% |
| Edibles | 6.6% |
| Pre-rolls | 3.5% |
| Accessories | 2.7% |
| Beverages | 1.4% |
| Tinctures and topicals | 1.2% |
Flower and vapes together account for more than three quarters of category spend. The remaining six categories share less than a quarter between them.
Reach and revenue are two different maps
If you rank Ohio categories by how many shoppers touch them rather than by spend, the order changes and the spread narrows sharply.
| Category | Share of shoppers who bought it | Share of category spend |
|---|---|---|
| Flower | 71.7% | 59.2% |
| Edibles | 34.8% | 6.6% |
| Vapes | 32.6% | 16.4% |
| Pre-rolls | 28.3% | 3.5% |
| Concentrates | 23.9% | 8.9% |
| Accessories | 13.0% | 2.7% |
| Beverages | 10.9% | 1.4% |
Edibles reach about half as many Ohio shoppers as flower does, yet bring in roughly one ninth of the spend. Pre-rolls reach more than a quarter of shoppers and return 3.5%. Beverages reach about one in nine shoppers and return 1.4%.
Those categories are not failing to find an audience. They are failing to convert that audience into revenue.
The basket maths behind the gap
Two forces drive the spread, and both favour flower.
Price. Indexed against the average flower line at 100, the average concentrate line runs about 81, vapes about 71, accessories about 52, edibles about 34, pre-rolls about 31 and beverages about 24. An edible sale is worth roughly a third of a flower sale.
Frequency. Ohio flower buyers made about 3.5 flower purchases each over the month. Vape buyers made about 3.0. Edible buyers made about 2.3. Pre-roll buyers made about 1.7. Flower is both the bigger line and the more repeated one.
Multiply a third of the price by half the frequency and the revenue gap stops looking surprising.
Ohio grew while the national market slipped
Ohio retail spend rose 25.4% month over month. Across all tracked states, retail spend fell 2.2% over the same period. Ohio was moving against the trend.
The retention picture is less flattering. Ohio’s repeat rate, meaning shoppers with two or more visits, came in at 54.3% against 61.5% nationally. Its loyalty rate, meaning three or more visits, was 30.4% against 41.3% nationally. Visits per shopper ran roughly 31% below the national retail average.
Ohio is adding volume faster than it is adding depth. That is a solvable problem, and category mix is one of the levers.
No chain owns Ohio
The largest chain in the state took about 17.5% of tracked retail spend. The top three together took under 40%. We covered that fragmentation in more detail in our earlier read on the Ohio market, and it has not resolved.
Share of wallet tells you why that matters. Four of the ten largest Ohio chains showed 100% share of wallet, meaning their shoppers were not tracked buying anywhere else. The largest chain showed 79.1%. Scale, in this market, comes with leakage.
What Ohio operators can do with this
- Stop treating reach as traction. A category that a third of your shoppers try but that returns under 7% of spend has a basket problem, not an awareness problem.
- Attach, do not convert. Edibles and pre-rolls already sit in the basket. The upside is in multi-unit attachment at the flower purchase, not in persuading flower buyers to switch.
- Price the repeat, not the trial. Flower’s advantage is frequency. Any category priced at a third of flower needs roughly three times the purchase rate to matter.
- Defend the wallet before chasing the market. With repeat rate seven points below national, the cheapest growth in Ohio is the second visit you already nearly earned.
Reaching those shoppers is its own constraint. Cannabis operators cannot buy attention on the platforms everyone else uses, which is why owned channels carry so much weight. We break that down in why cannabis brands cannot advertise on Google, Meta or TikTok.
Frequently asked questions
Which cannabis category leads Ohio retail?
Flower. It took 59.2% of tracked category spend across Ohio retail chains last month, ahead of vapes at 16.4% and concentrates at 8.9%.
Are edibles growing in Ohio?
Edibles have broad reach but thin revenue. About 34.8% of Ohio shoppers bought an edible, yet the category returned only 6.6% of spend, because the average edible line prices at roughly a third of the average flower line.
How fast is the Ohio cannabis market growing?
Ohio retail spend rose 25.4% month over month, while tracked retail spend nationally fell 2.2% over the same period.
Is Ohio a loyal cannabis market?
Less loyal than the national average. Ohio’s repeat rate was 54.3% against 61.5% nationally, and its three-or-more-visit loyalty rate was 30.4% against 41.3%.
Does any chain dominate Ohio cannabis retail?
No. The largest chain held about 17.5% of tracked retail spend and the top three together held under 40%, which leaves the market open.
See your own market this clearly
HighRewards turns dispensary receipts into category, chain and share-of-wallet views like this one, state by state. If you operate in Ohio or anywhere else on the map, we can show you where your basket is leaking.