Illinois dispensary chains do not have a competition problem. They have a coming-back problem.
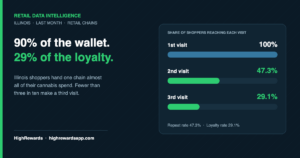
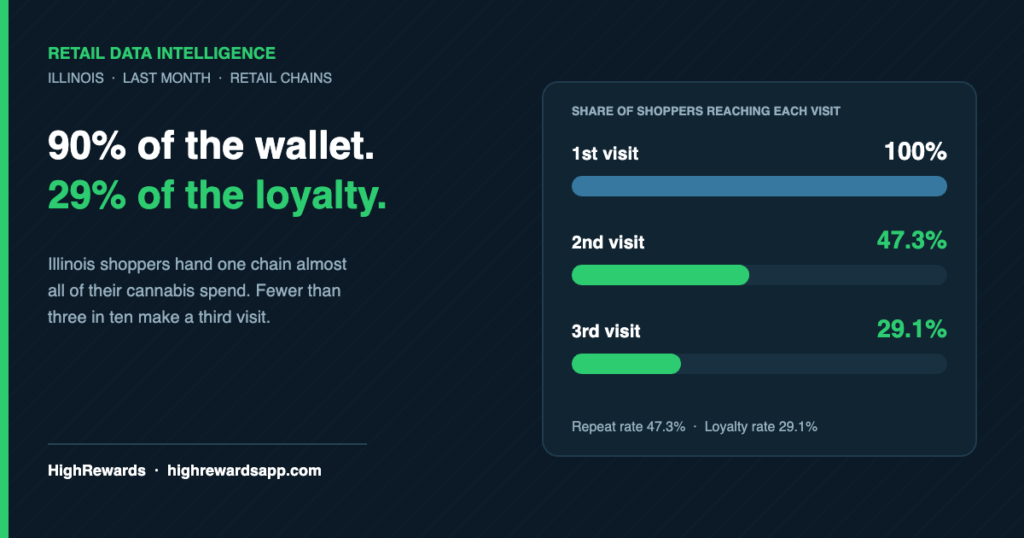
Across Illinois retail chains last month, the top-ranked operators held more than 90% share of wallet among the shoppers who visited them. When an Illinois shopper picks a store, they mostly stop shopping anywhere else. And yet only 29.1% of shoppers in the state reached a third visit in the month.
That combination is unusual, and it changes what a marketing budget should be doing.
Illinois shoppers are loyal while they are active
Share of wallet measures how much of a shopper’s total cannabis spend goes to one chain. In most retail categories, a number above 70% is considered strong. Illinois last month:
- The number one chain by revenue held 94.9% share of wallet.
- The number two chain held 89.2%.
- The number three chain held 90.7%.
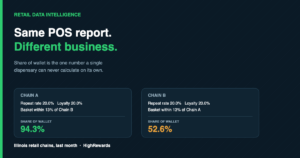
- Only two chains in the top ten fell below 74%, and one of those sat at 52.6%.
So switching is not the leak. Illinois shoppers are not splitting baskets across four dispensaries. They pick one and stay.
The drop-off happens between visit two and visit three
Statewide, 47.3% of Illinois shoppers made a second visit last month. Only 29.1% made a third. Average visits per shopper landed at 2.6, and the market contracted 20.7% month over month.
Read those two numbers together and the picture is clear. Illinois chains are winning almost all of a shopper’s wallet for a short window, then losing the shopper entirely. Revenue is not moving to a competitor. It is going quiet.
The top three chains are not equally good at this
All three leaders sit in a tight band on second-visit rate, between 44% and 46%. The third-visit numbers spread much wider:
- The number two chain converted 44.4% of its shoppers to a third visit, well above the 29.1% state figure.
- The number three chain reached 33.3%.
- The number one chain, the revenue leader, reached only 27.3% and finished below the state average.
Being the biggest chain in Illinois and being the stickiest chain in Illinois are currently two different things. The revenue leader is buying more first visits than it keeps.
A bigger basket does not fix a frequency problem
The revenue leader’s average basket ran about 23% above the Illinois average, and the number two chain about 16% above. Both still landed inside that narrow 44% to 46% second-visit band.
Basket size and return rate are moving independently here. Upselling a shopper who is about to lapse just makes the last receipt larger.
One brand is running away with the shelf
Brand concentration in Illinois is far tighter than in markets like Pennsylvania, where no single brand has broken away. Last month the leading Illinois brand took 20.2% of tracked brand spend. The number two brand took 7.1%, so the leader is running close to three times the size of its nearest rival.
For a challenger brand, that concentration is the argument for spending on shopper-level reach rather than shelf placement alone.
Category mix: pre-rolls do the traffic, flower does the money
Splitting Illinois category spend last month:
- Flower took 47.1% of category spend from 30.2% of purchases.
- Vapes took 19.6% of spend.
- Pre-rolls took 26.8% of all purchases but only 17.2% of spend, at an average price roughly 58% below flower.
- Concentrates and edibles landed at 7.7% and 7.1% of spend.
Pre-rolls are the highest-frequency item on the menu and the cheapest way to give a lapsing shopper a reason to walk in. In a market with a third-visit problem, that matters more than its revenue line suggests. We saw the same pattern in Ohio, where flower took 59% of category spend.
What Illinois operators should do with this
- Stop optimising for switching. At 90% share of wallet, there is very little wallet left to take from a rival. The upside is in visit three, not visit one.
- Trigger on the gap, not the calendar. The shoppers to reach are the ones who made two visits and went quiet, not the whole list on a Friday.
- Use a low-price, high-frequency hook. Pre-rolls already carry more than a quarter of Illinois purchases at a fraction of flower’s price.
- Judge campaigns on third-visit rate. Revenue rank and stickiness rank are not the same thing in this market, and the gap between them is where the margin is.
Cannabis operators cannot buy their way out of this with paid social. Google, Meta and TikTok still refuse the category, which is why most cannabis brands have to build reach through owned and rewards channels instead.
Frequently asked questions
What is share of wallet in cannabis retail?
Share of wallet is the percentage of a shopper’s total tracked cannabis spend that goes to a single chain. A chain at 90% share of wallet is capturing nine tenths of what that shopper spends on cannabis anywhere.
What is a good loyalty rate for an Illinois dispensary?
Illinois averaged 29.1% of shoppers reaching a third visit in a month. The strongest chain in the top three reached 44.4%. Anything below the state average means the chain is buying first visits faster than it keeps them.
Why did Illinois cannabis retail contract month over month?
The state finished 20.7% below the prior period. With share of wallet above 90% for the leading chains, the decline reflects shoppers going inactive rather than moving their spend to a competitor.
Do bigger baskets improve dispensary retention?
Not in Illinois last month. The two chains with baskets roughly 23% and 16% above the state average sat inside the same 44% to 46% second-visit band as their peers.
How is this Illinois cannabis retail data collected?
It comes from aggregated, anonymised receipt data uploaded by HighRewards members across Illinois retail chains, filtered to retail chains only for the most recent full month. No individual shopper data is published.
See your market the way your shoppers actually shop it
HighRewards tracks real receipts across dispensaries, so operators and brands can see share of wallet, repeat rate and category mix in their own state. Get in touch for a market report.