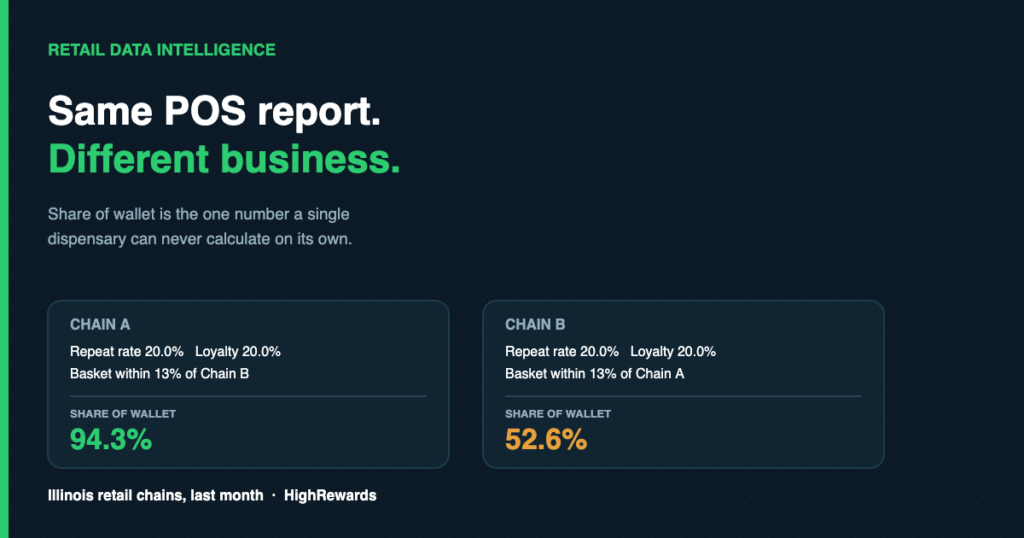
Two Illinois dispensary chains posted almost identical numbers last month.
Both converted 20.0% of their shoppers to a second visit. Both converted 20.0% to a third. Their average baskets sat within 13% of each other. Open either chain’s own dashboard and you would see two businesses with the same problem and the same opportunity.
One of them held 94.3% of its shoppers’ cannabis spend. The other held 52.6%.
Those are not the same business, and no point-of-sale system on the market could have told either one which it was.
Why share of wallet is invisible from inside one chain
Share of wallet is a fraction. The numerator is what a shopper spends with you. The denominator is what that shopper spends on cannabis anywhere.
Your POS owns the numerator completely. It has never seen the denominator and it never will, because the denominator is made up of receipts from your competitors’ registers.
This is not a software limitation anyone can patch. It is structural. Every retention metric a dispensary computes in-house is really a measure of behaviour within its own four walls, which is why two chains with identical internal numbers can be in completely different competitive positions.
The two chains need opposite playbooks
Take the chain at 94.3%. Its shoppers are not going anywhere else. When one stops showing up, the spend has left the category or gone dormant, not moved down the road. Discounting to win back share it already owns would burn margin on shoppers it was never at risk of losing. Its job is frequency: give a loyal, low-frequency shopper more reasons to come in.
Now the chain at 52.6%. Roughly half of its shoppers’ cannabis spend is happening somewhere else, every month, while those same shoppers keep walking through its door. Its job is not retention at all. It is recapture, and the addressable prize is sitting in plain sight.
Same repeat rate. Same loyalty rate. Opposite strategies. The only thing that separates them is a number neither chain can produce on its own.
Three more things that only appear across chains
Whether a soft month is switching or lapsing
Illinois retail contracted 20.7% month over month. Read alone, that looks like a market losing a share war. Read alongside wallet share above 90% for the leading chains, it is obviously something else: shoppers going quiet, not changing stores. Those two diagnoses lead to completely different budgets, and only one of them is right.
How concentrated the brand shelf really is
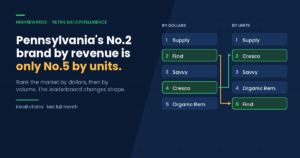
The leading brand in Illinois took 20.2% of tracked brand spend last month, close to three times its nearest rival. In Pennsylvania, no brand has broken away at all. A brand manager reading only their own sell-through data cannot tell which kind of market they are fighting in.
Which categories actually reach shoppers
Revenue rank and reach rank are different questions. In Michigan, pre-rolls reach more shoppers than flower despite carrying a fraction of the spend. A category that touches the most shoppers is the cheapest lever for frequency, and it rarely sits at the top of a revenue report.
What this changes, depending on where you sit
- If you run a chain: your retention numbers are directionally useful and strategically incomplete. Knowing whether you hold 94% or 52% of the wallet decides whether you spend on frequency or recapture.
- If you run a brand: sell-through tells you what moved. It does not tell you how concentrated the shelf is, or which categories put your product in front of the most shoppers.
- If you are underwriting one: two chains with matching internal metrics can carry very different competitive risk. Wallet share is the number that separates a durable position from a fragile one.
Where the number comes from
HighRewards members upload receipts from wherever they shop, because the rewards travel with the shopper rather than the store. That produces something a single retailer’s data never can: an aggregated, anonymised view of the same shopper across competing chains.
It is also why the category’s advertising problem and its measurement problem have the same answer. Google, Meta and TikTok still refuse cannabis, so reach has to be built through owned and rewards channels — and those are precisely the channels that generate cross-chain visibility as a by-product.
Frequently asked questions
What is share of wallet in cannabis retail?
It is the percentage of a shopper’s total cannabis spend that goes to one chain. A chain at 94% share of wallet captures almost everything that shopper spends on cannabis anywhere; a chain at 52% is splitting that shopper with competitors.
Why can’t my POS calculate share of wallet?
Because the denominator sits outside your business. Calculating it requires knowing what your shoppers spent at competing dispensaries, which only appears in data collected across chains rather than within one.
Is a high share of wallet always good?
It means your position is secure, but it also caps your upside. A chain above 90% has very little competitor spend left to win and should focus on visit frequency instead. A chain near 50% has more room to grow from shoppers it already serves.
How is this data collected?
From aggregated, anonymised receipts uploaded by HighRewards members across retail chains, filtered to retail only and to the most recent full month. No individual shopper data is published or shared.
See your own wallet share
We build market reports for operators and brands in the states we cover, showing share of wallet, repeat and loyalty rates, brand concentration and category reach. Ask for a report on your market.